1
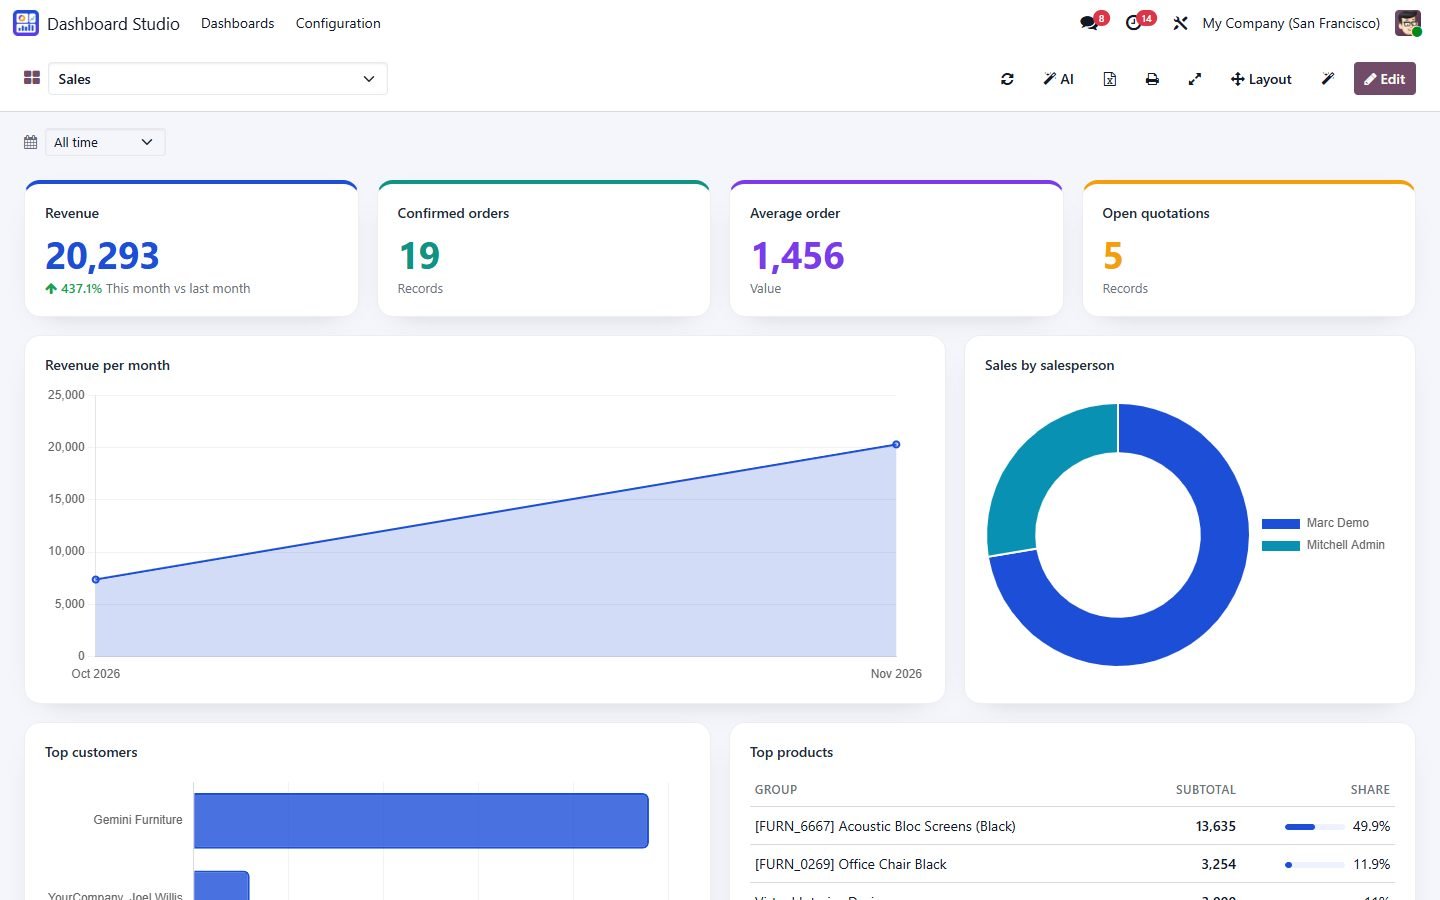
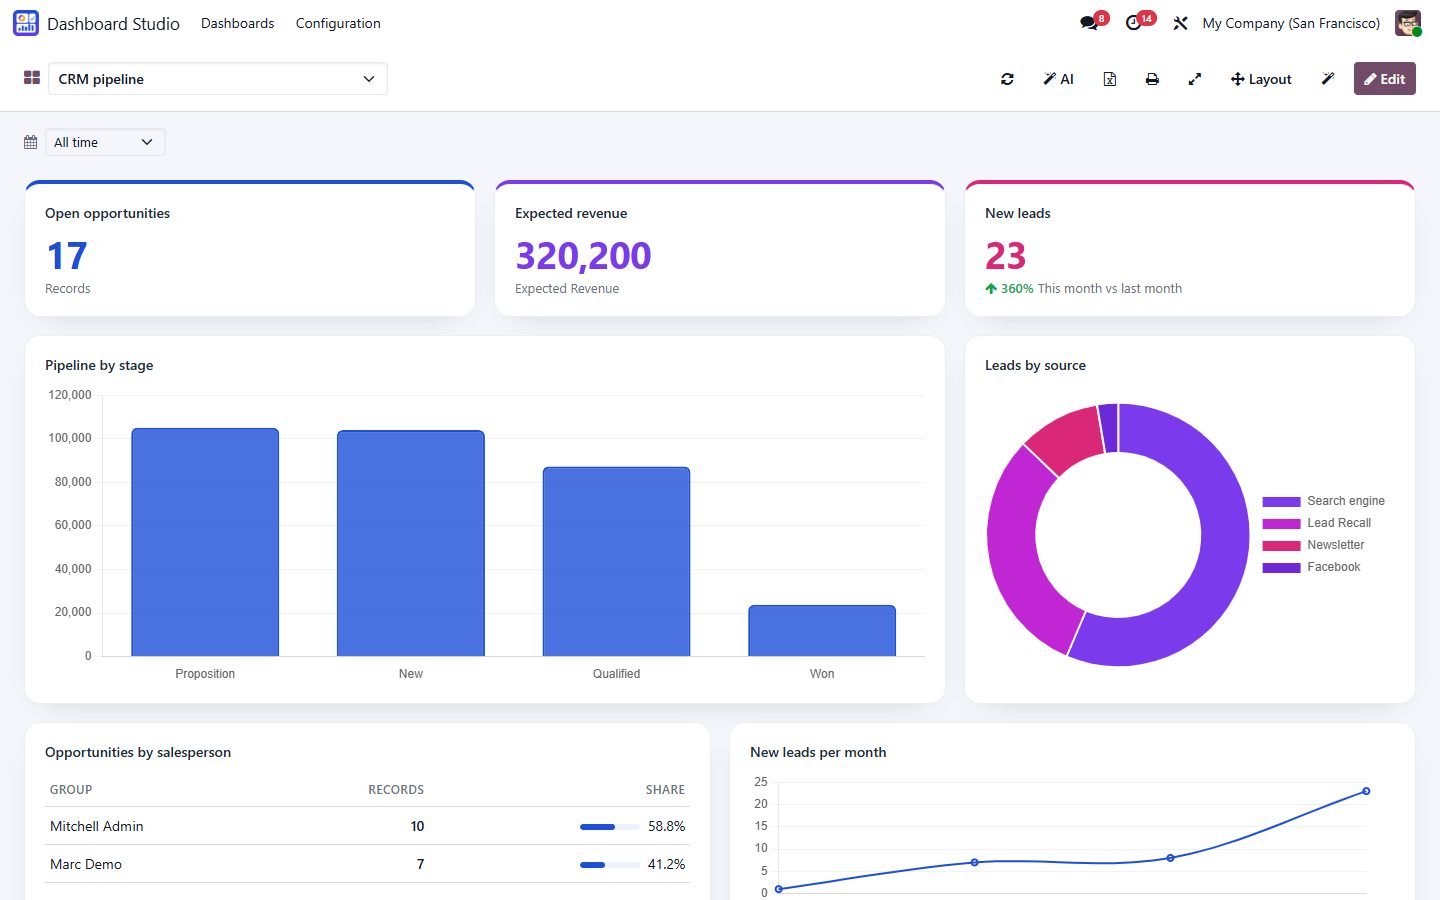
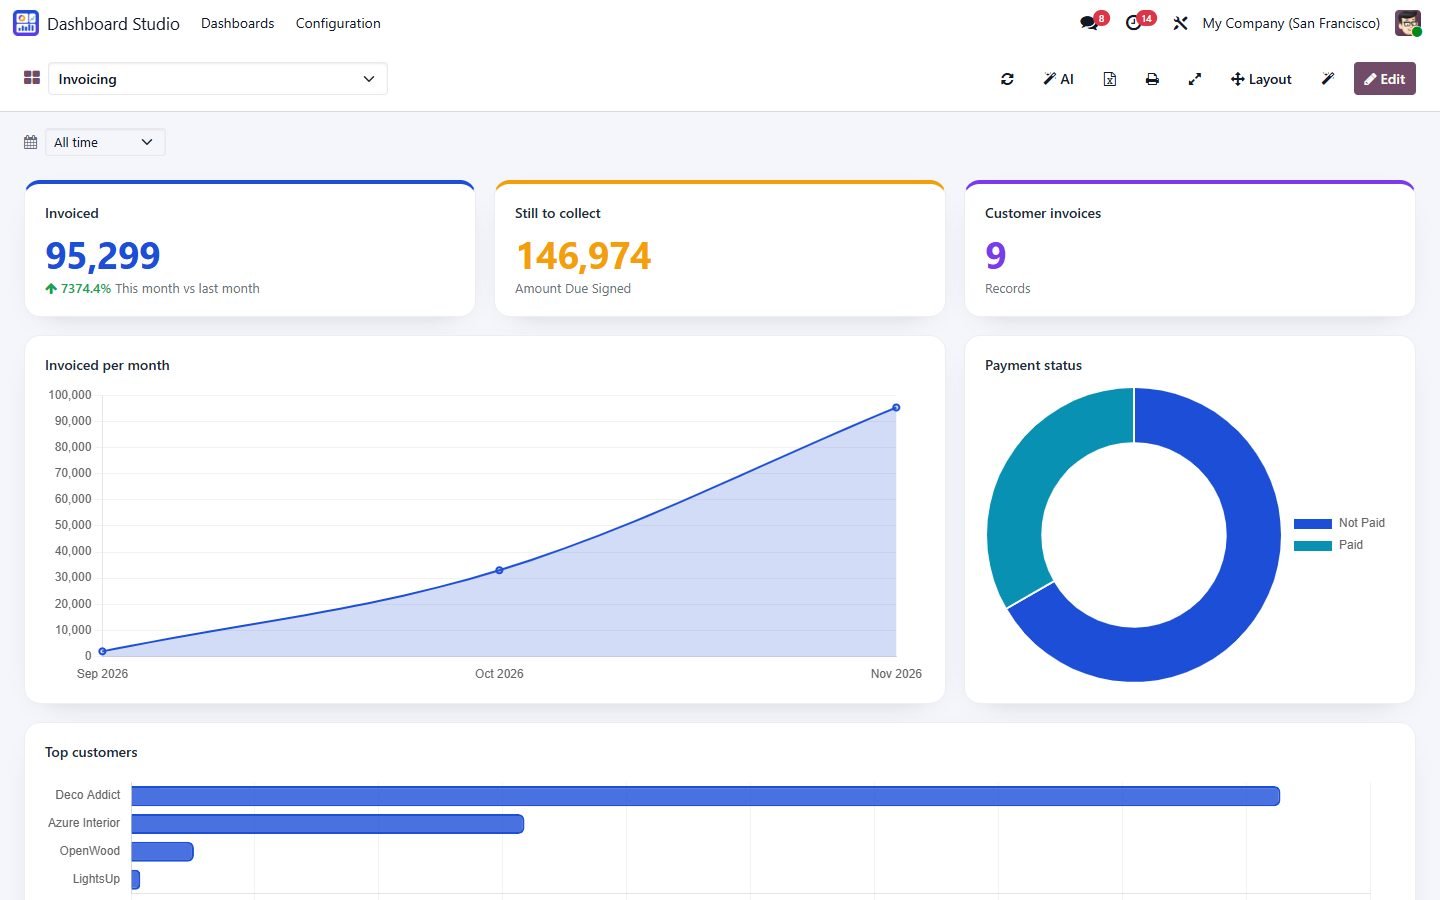
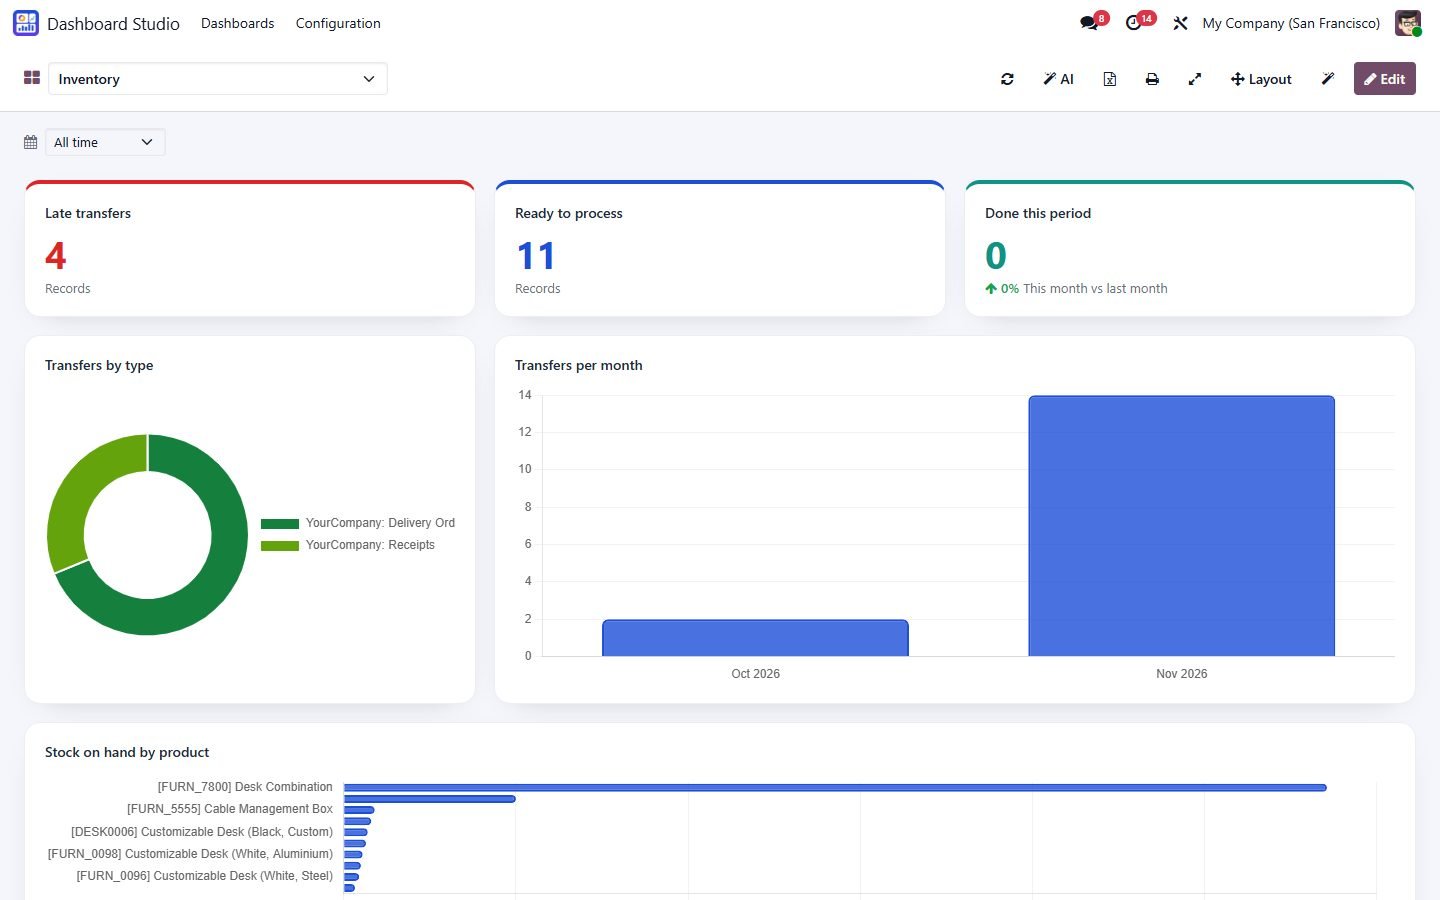
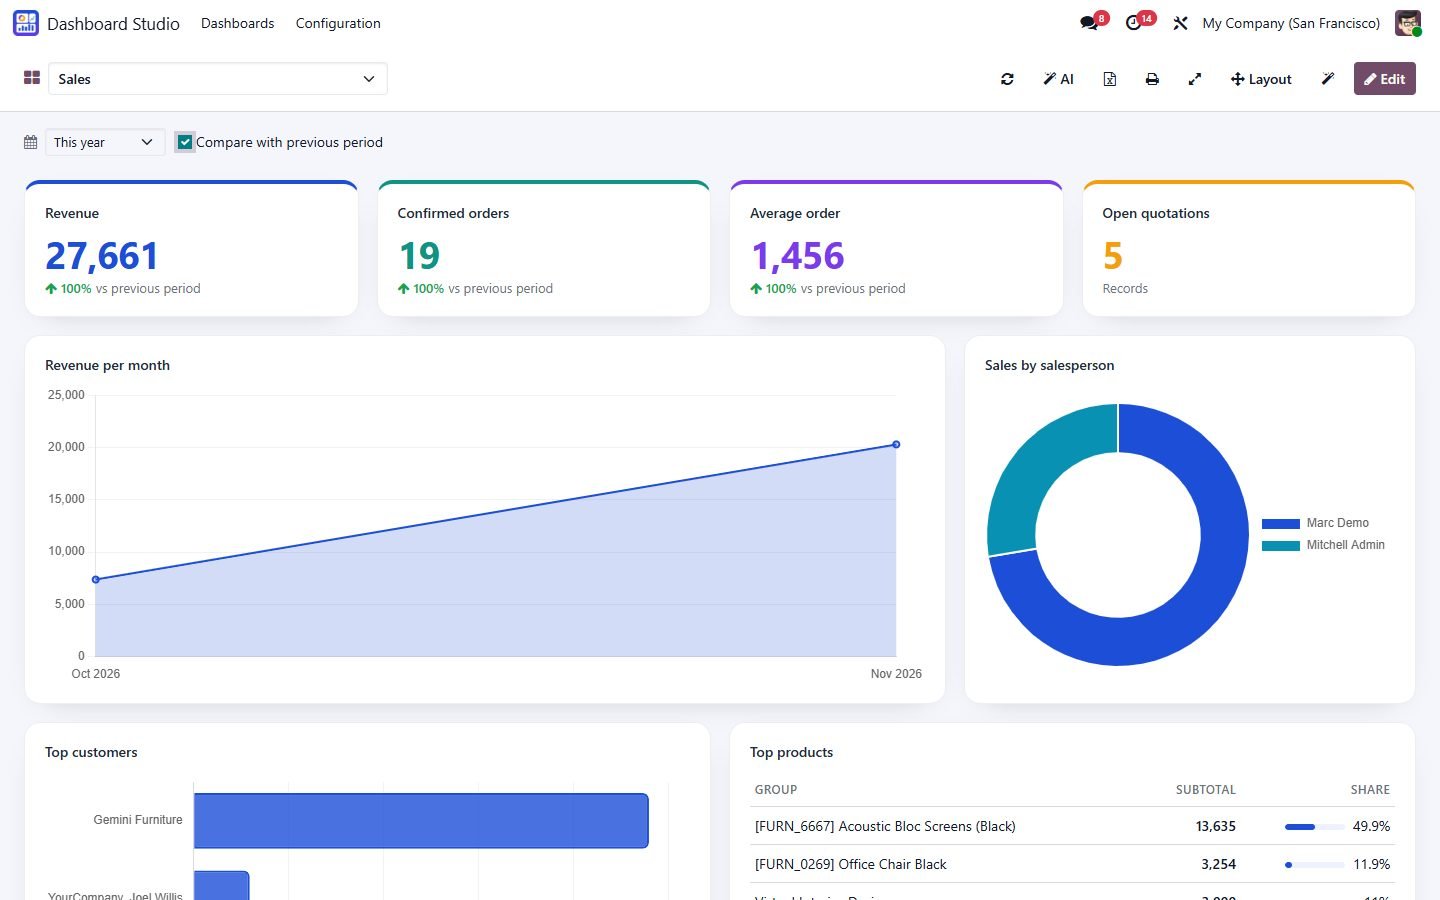
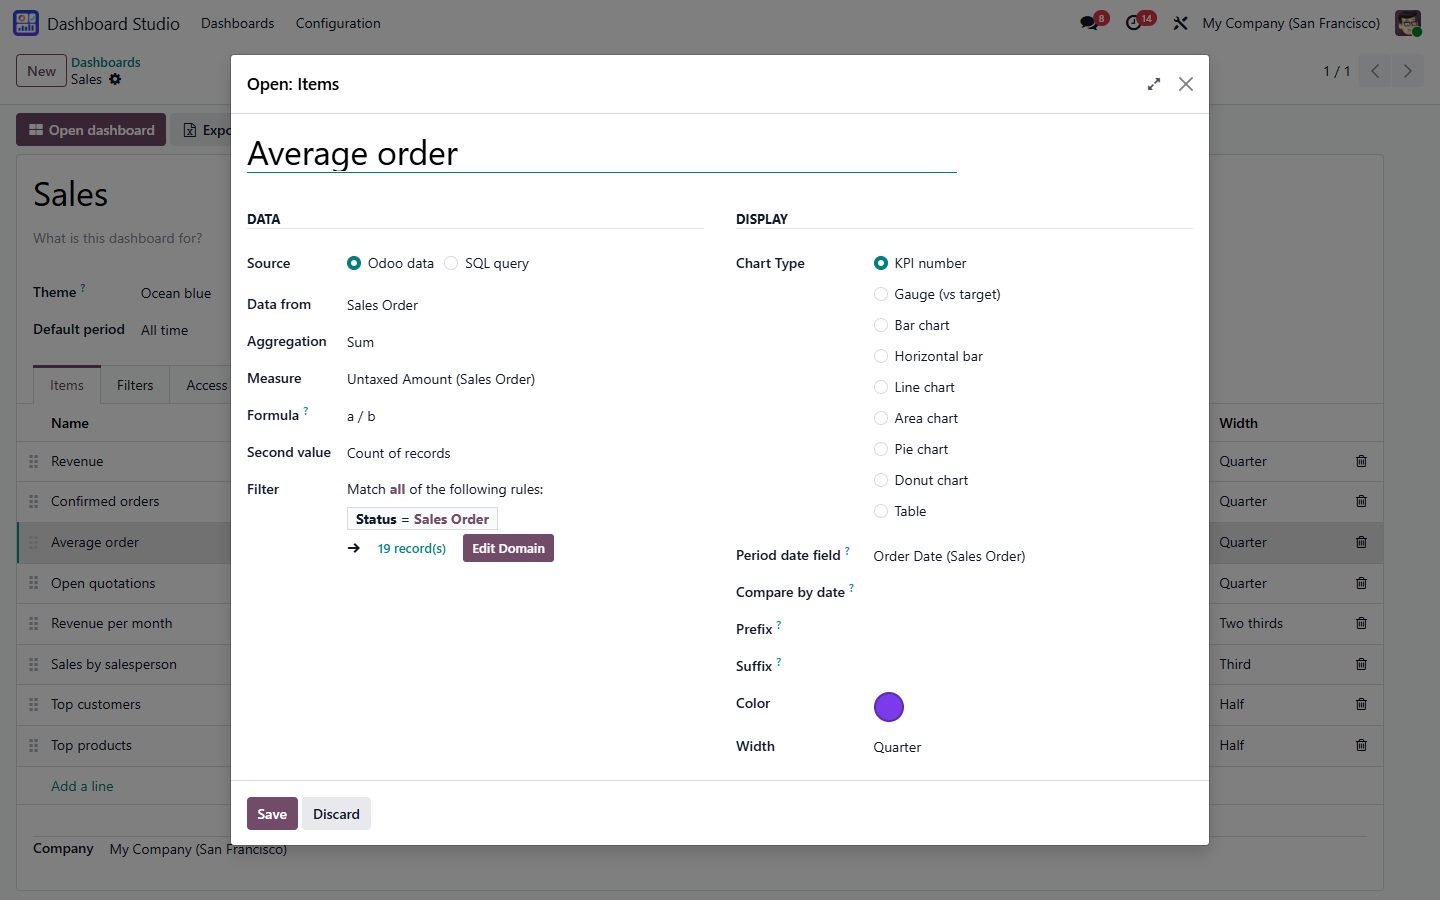
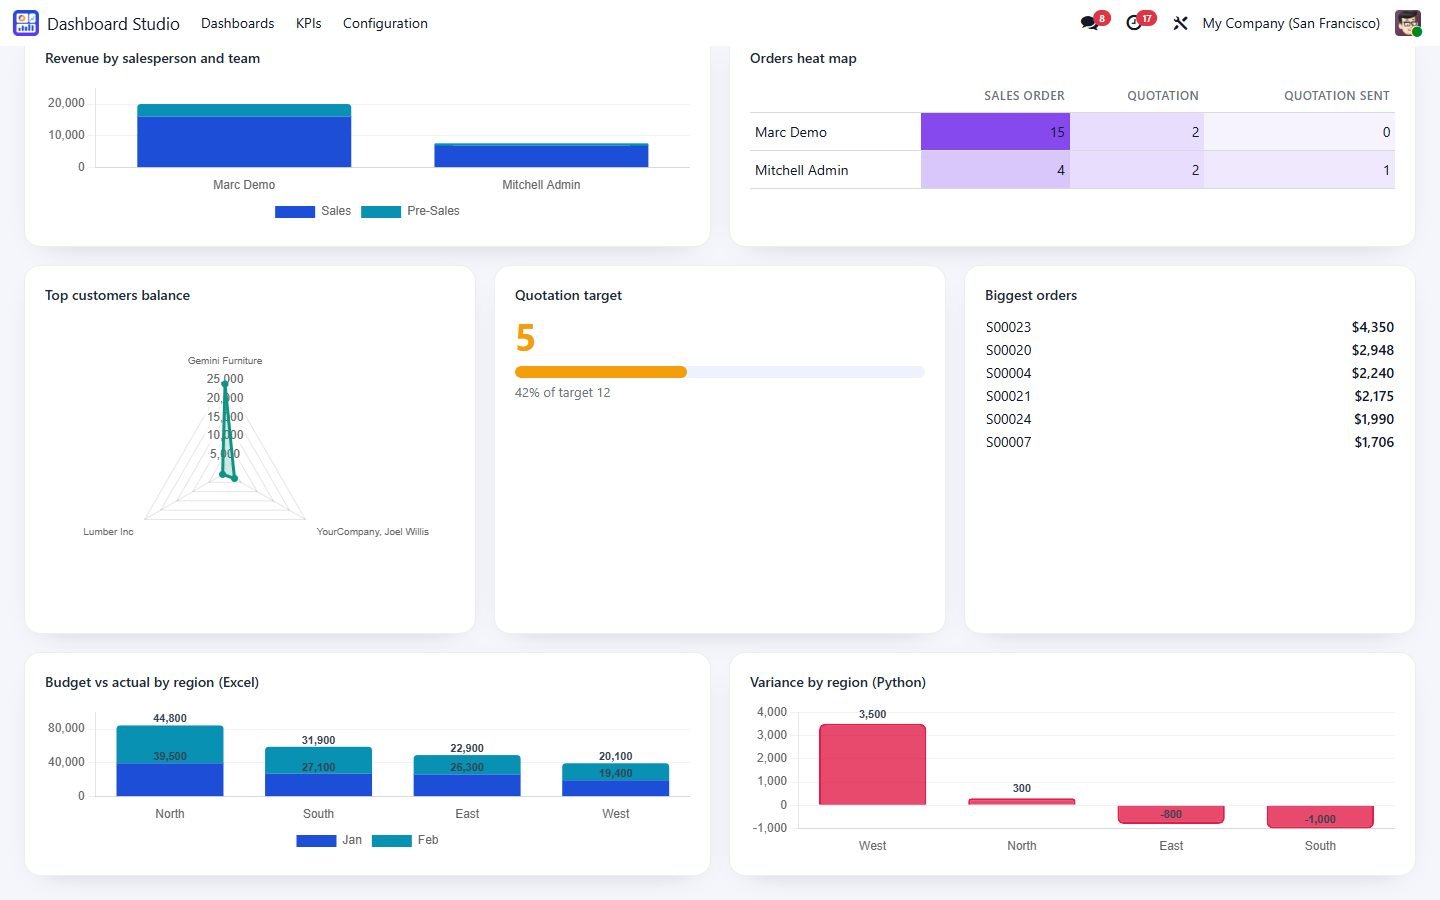
Dashboards from any Odoo data: count, sum, average, min or max, grouped by any field or by day, week, month, quarter or year
2
KPI, gauge with target, bar, horizontal bar, line, area, pie, donut and table, five colour themes
3
KPI trends: this period vs the previous one with green and red arrows
4
One filter bar: period presets or custom range, compare with previous period, salesperson / customer / company filters, auto-refresh
5
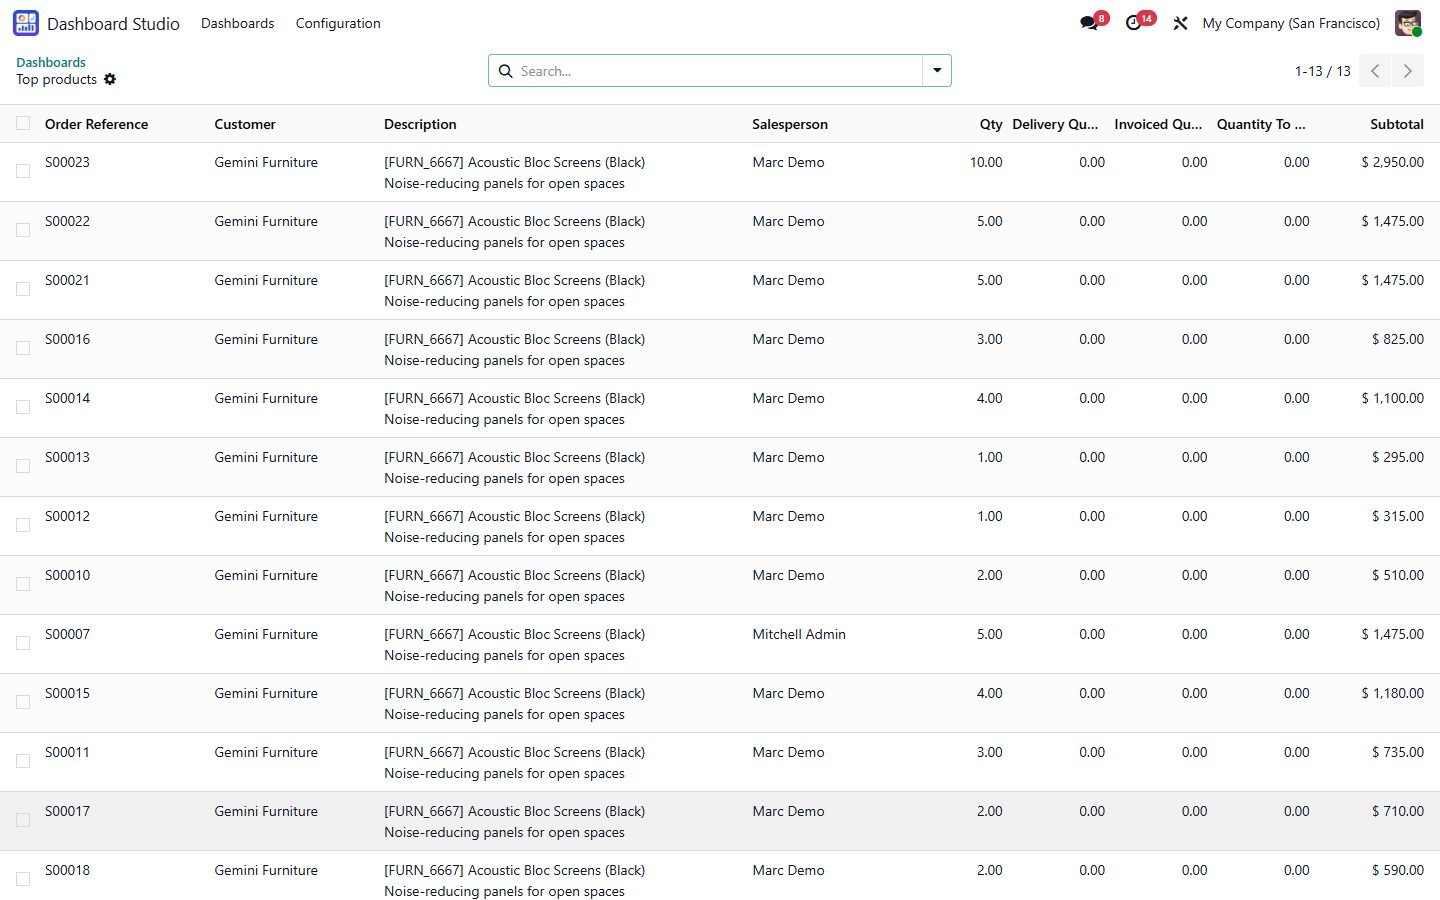
Click any bar, slice, table row or KPI to open the records behind it
6
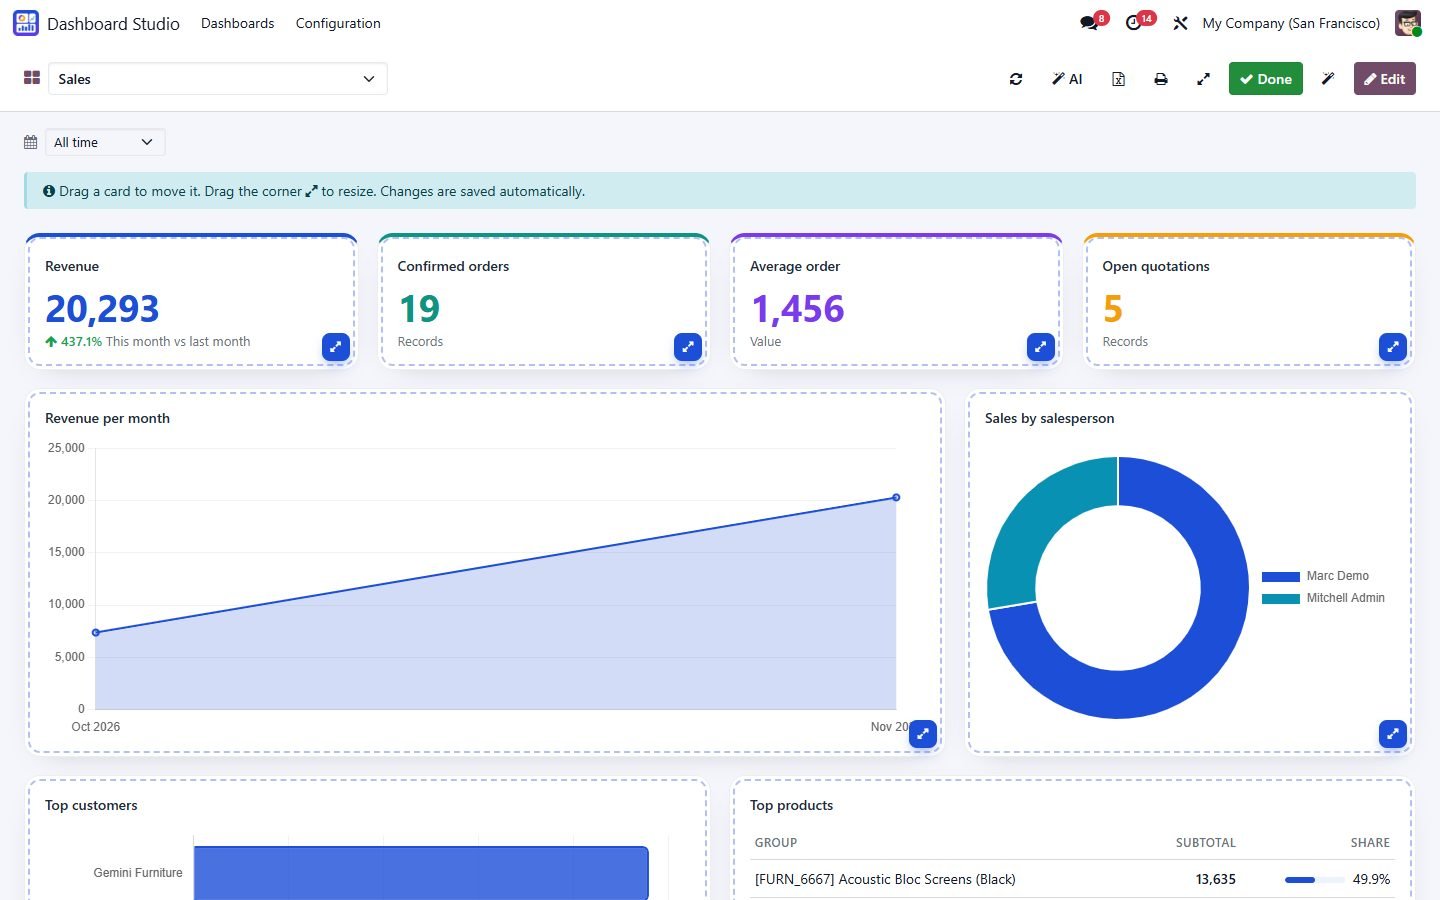
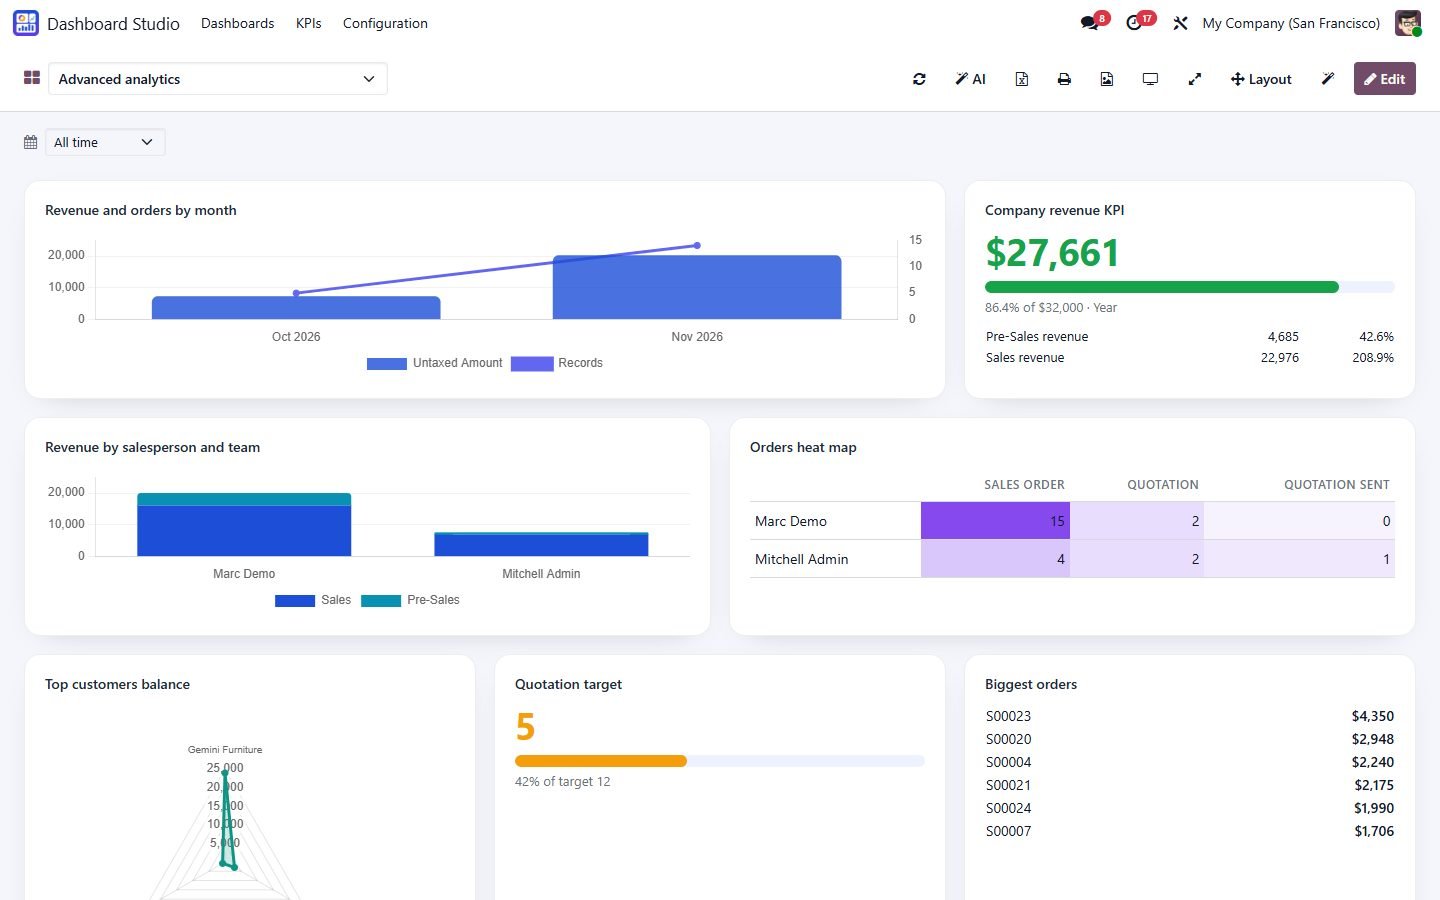
Drag and drop cards, resize them, layout saved automatically, full-screen mode for TVs
7
Calculated metrics (a / b) and read-only SQL items for administrators
8
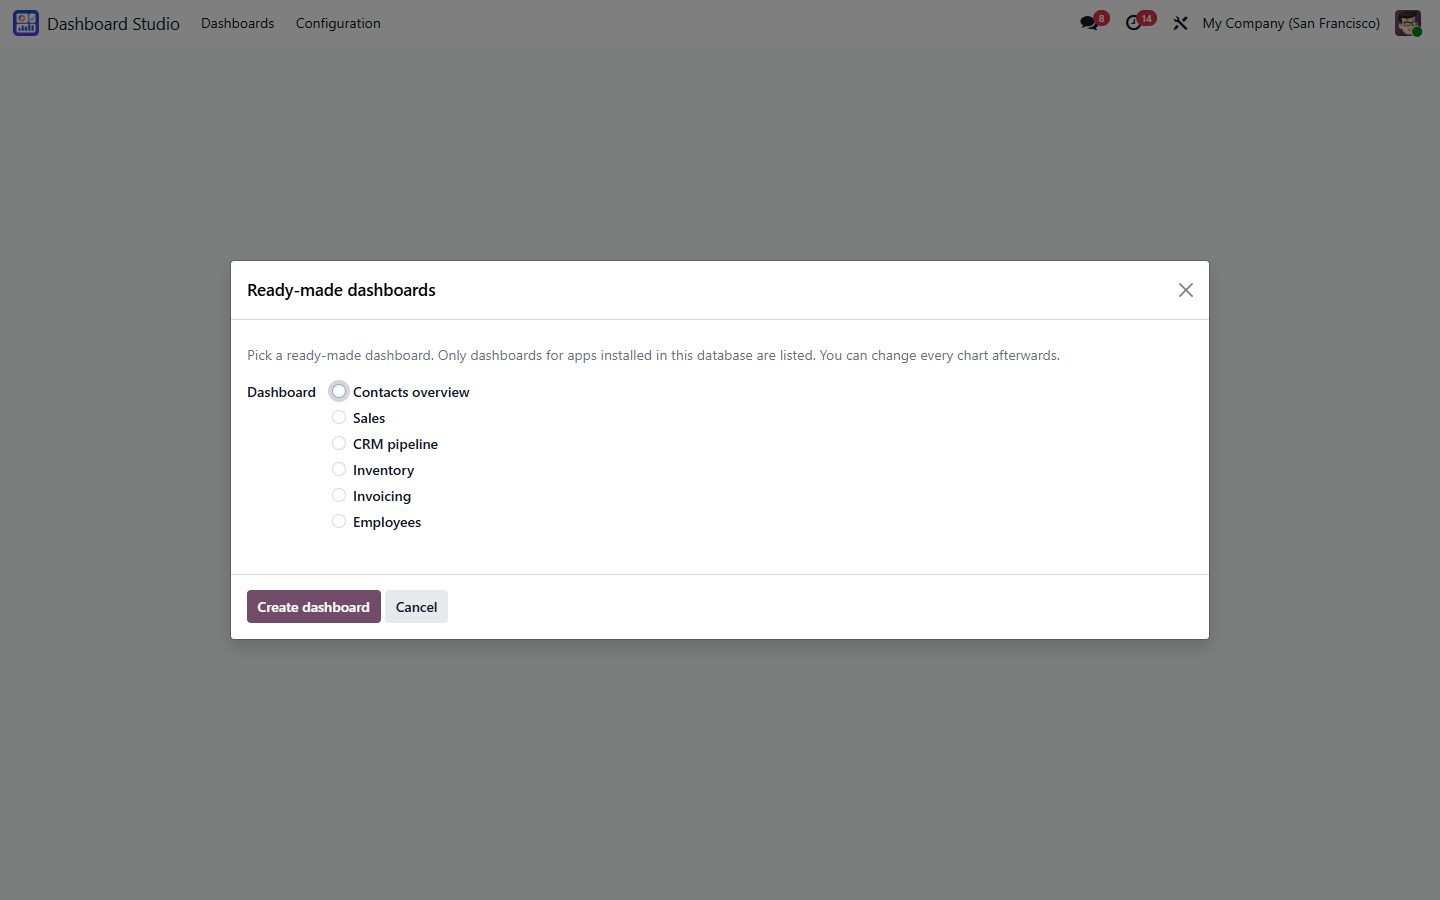
Ready-made dashboards for Sales, CRM, Inventory, Invoicing, Employees and Contacts, only for installed apps
9
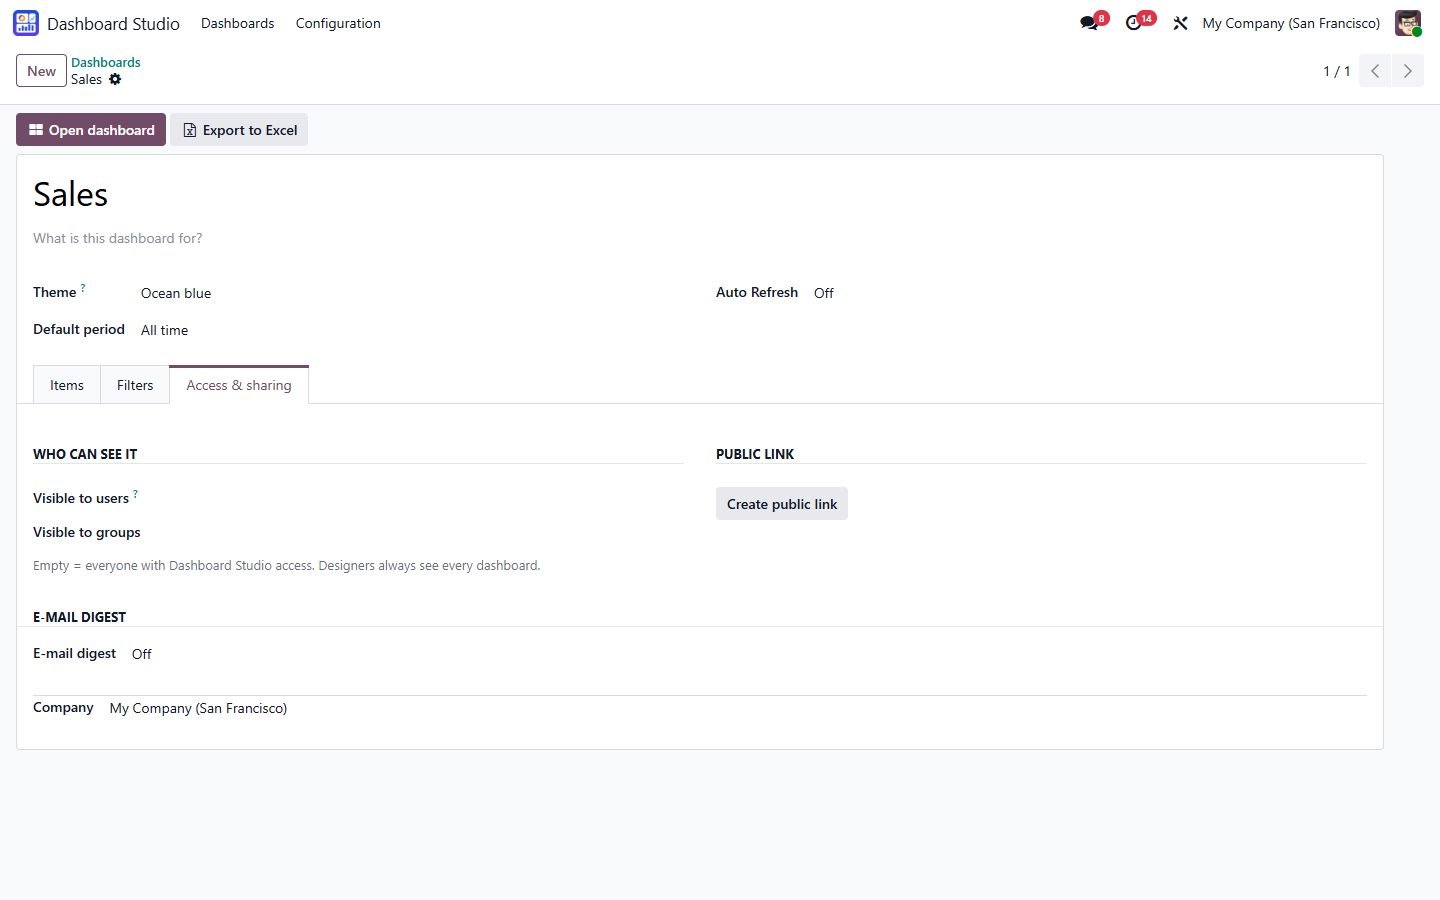
Access per user and group, secret public link, Excel export, print / PDF
10
Daily, weekly or monthly e-mail digest with KPIs and top groups
11
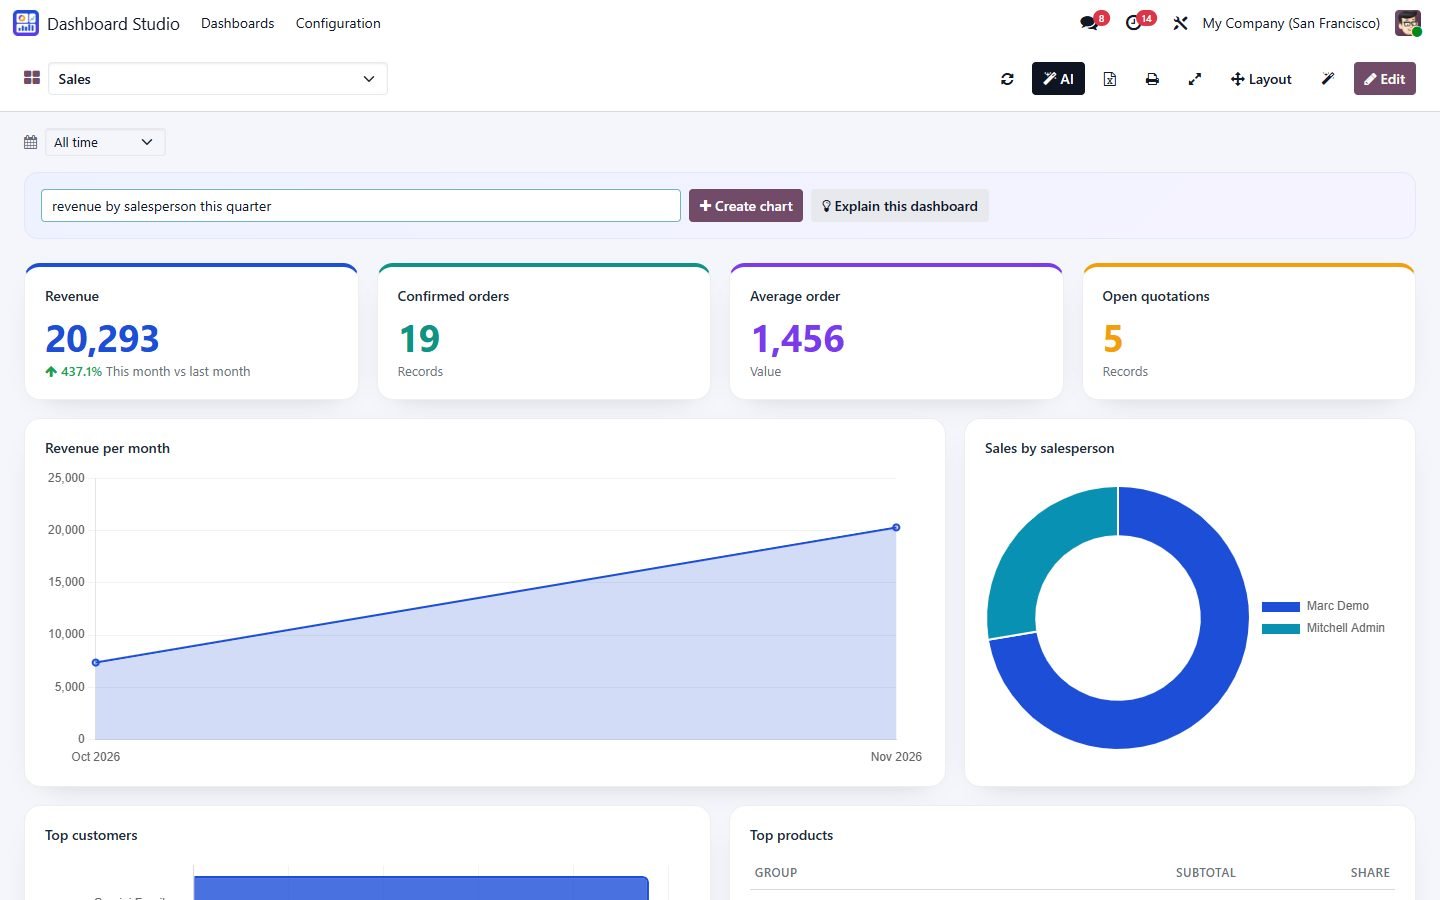
AI: build a chart from a question and explain the dashboard (OpenAI, Gemini or Claude, your own key)
12
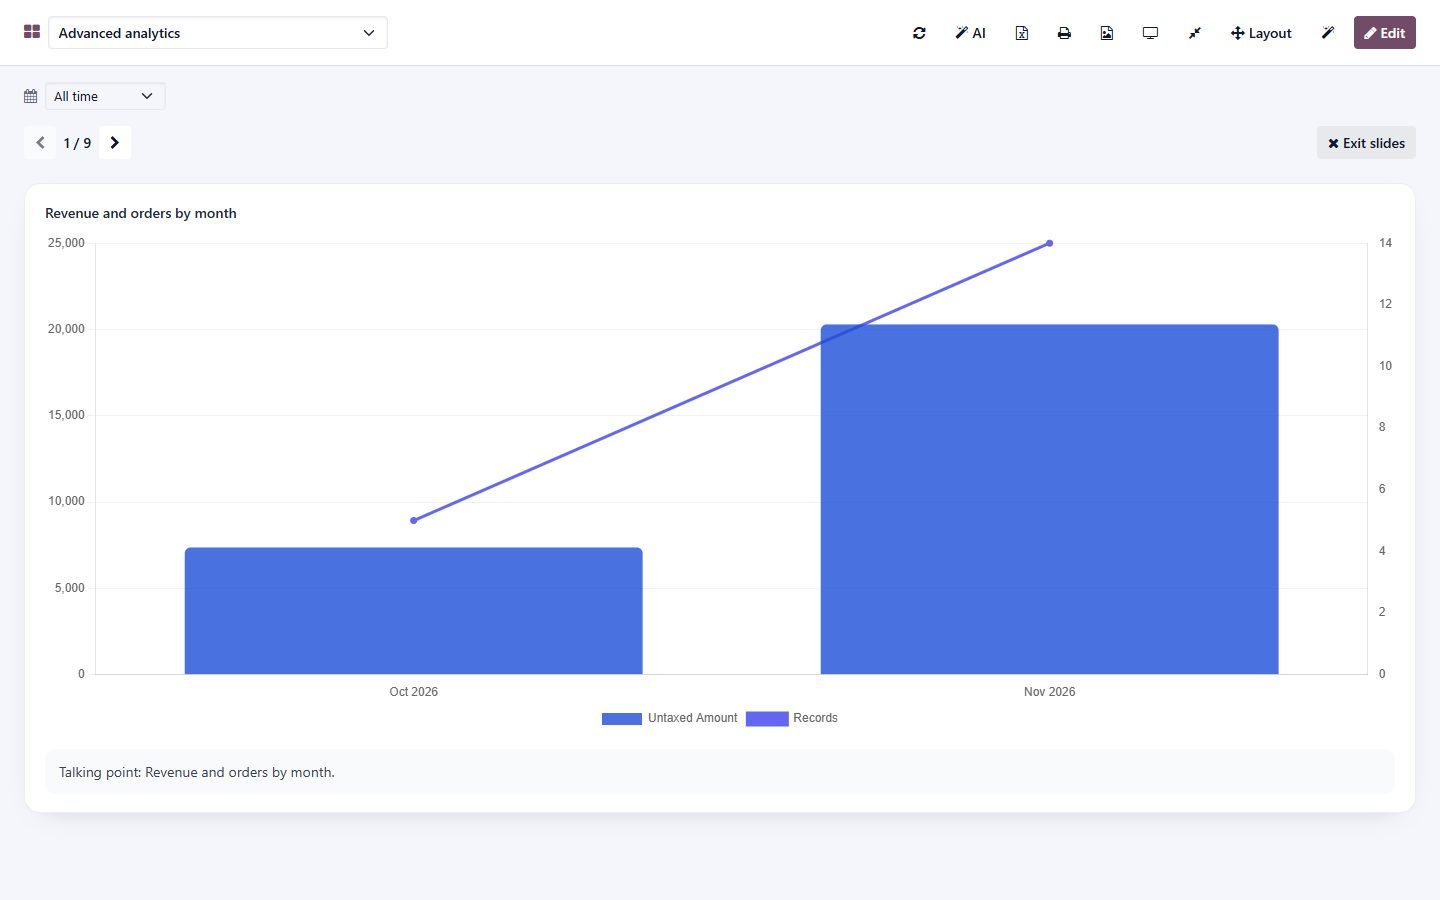
More charts: stacked bar, bar + line with two measures, radar, scatter, bullet vs target, heat map, record list and embedded web pages
13
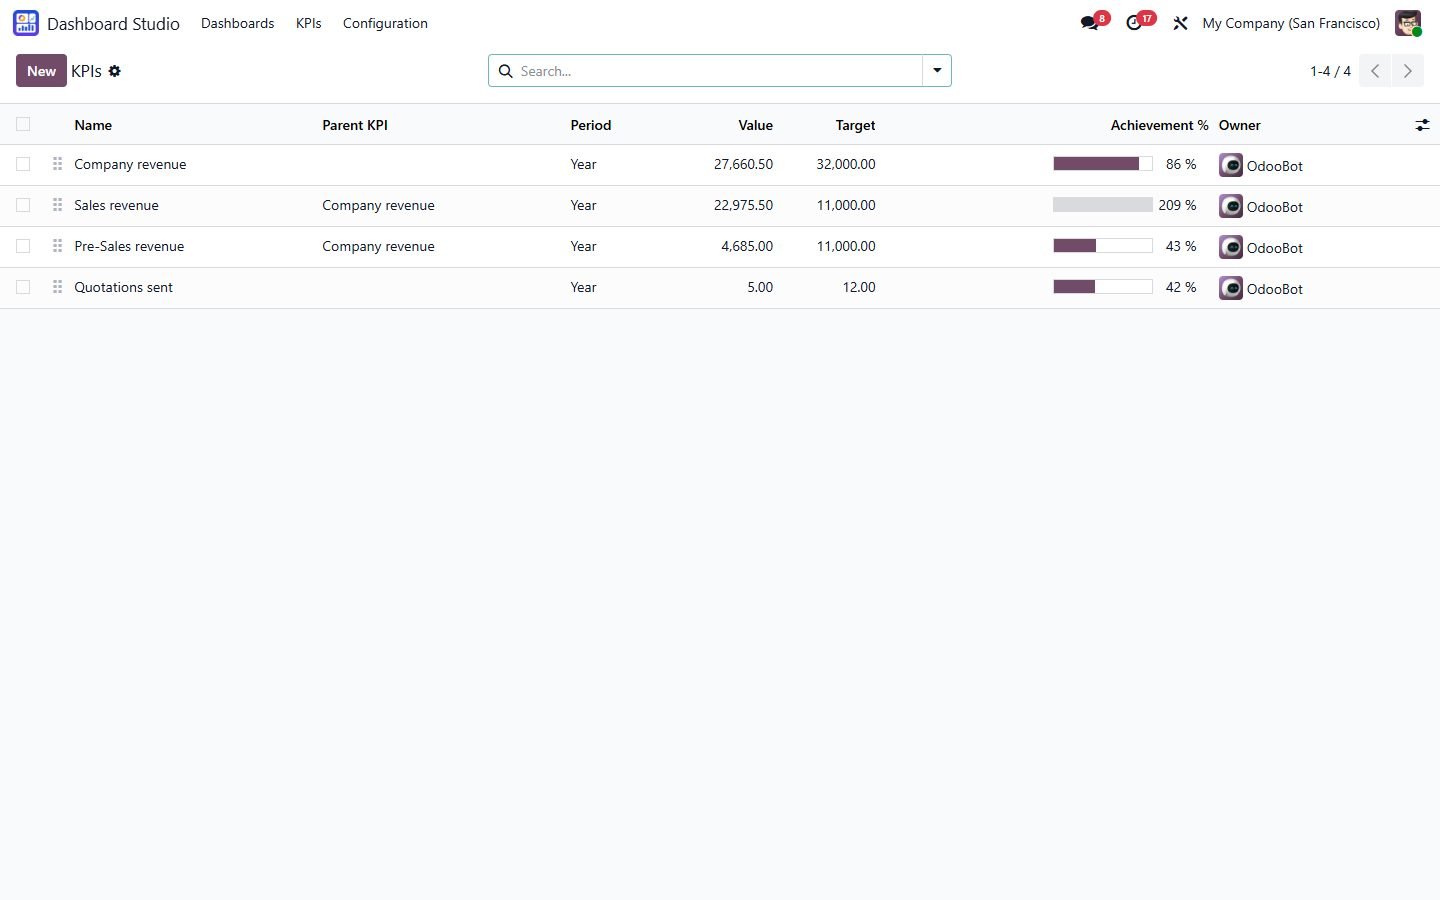
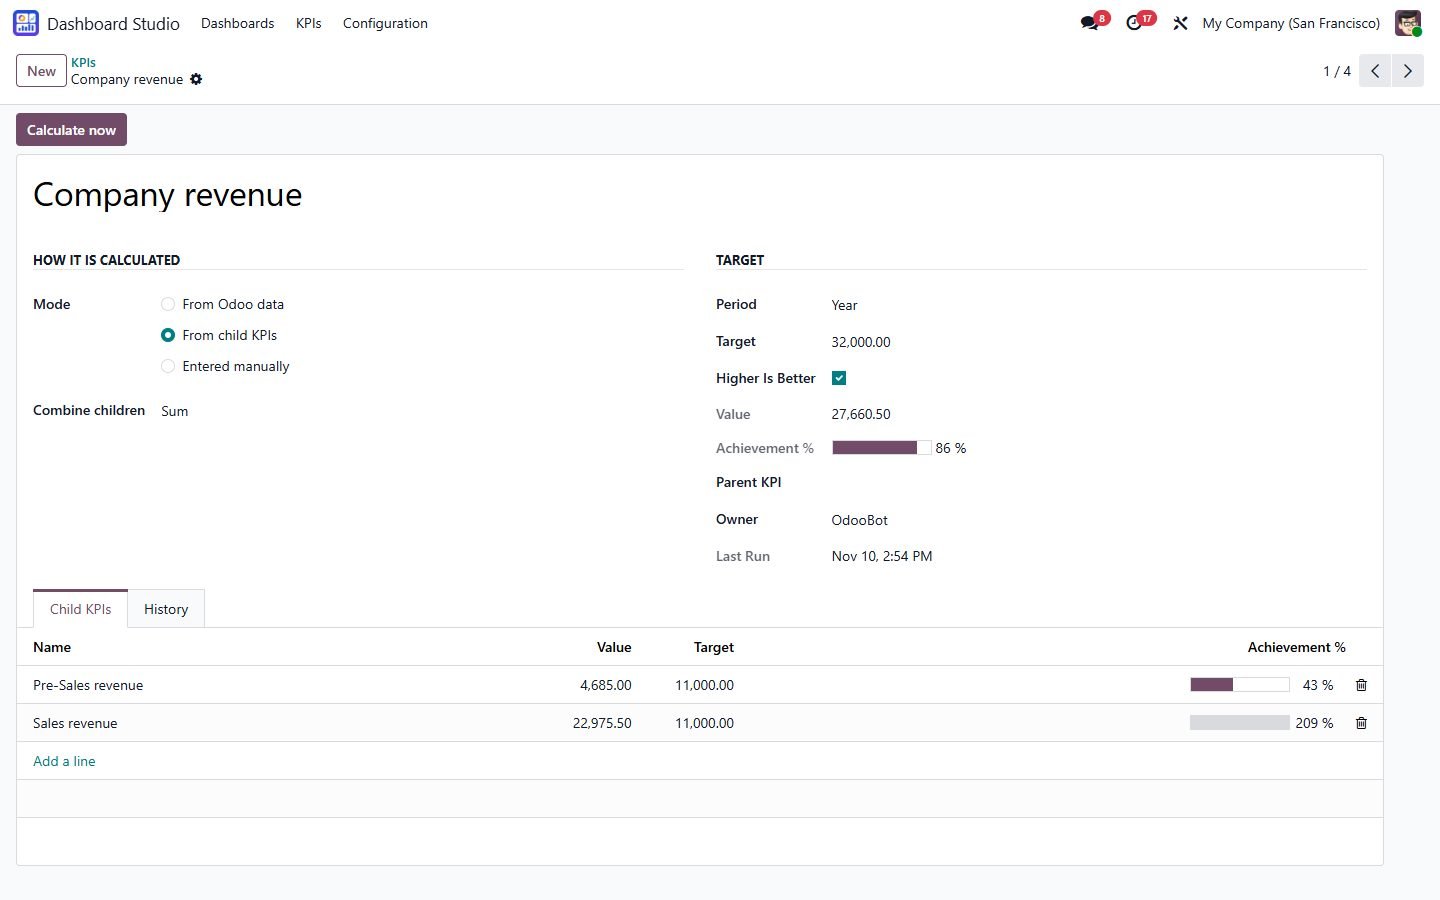
KPI system: monthly, quarterly or yearly targets, multi-level KPIs rolled up from child KPIs, achievement %, history, hourly auto-calculation, import / export
14
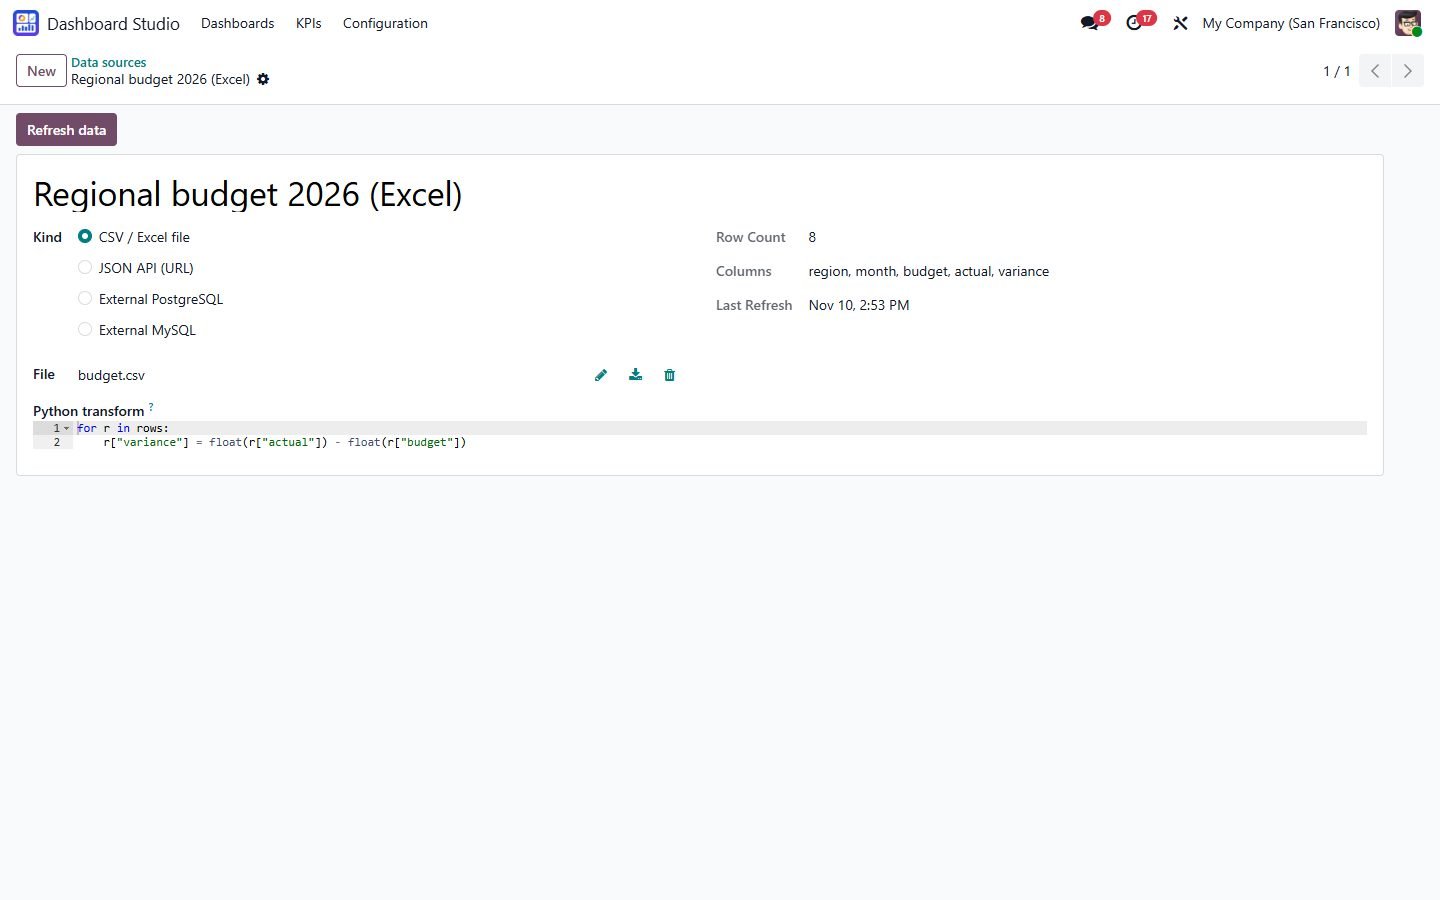
Data sources beyond Odoo: CSV and Excel upload, JSON APIs, external PostgreSQL and MySQL, plus a Python transform step
15
Present as slides with speaker notes, and download the whole dashboard as one PNG image
16
AI consultant chat: ask follow-up questions about your numbers in plain language
17
Sort by value or name, show values on charts, company currency formatting
18
Odoo 14 to 20, Community and Enterprise